
Solana price has finally broken past the $30 price mark and flipped that level into a support line. SOL has gained 6% in the last 24 hours. In the last week, the coin moved up by 4%.
The Bitcoin rally has pushed many altcoins up on their respective price charts. Major altcoins have traveled northbound as they followed Bitcoin’s price action.
The technical outlook of Solana has displayed bullish price action on the chart. The demand for the coin has shot up, which has caused buyers to enter the market.
SOL’s next price movement remains crucial. A move above the $34 mark remains important for the coin as that will help the bulls to garner further momentum.
If Solana attempts to topple above the $34 price mark, then a chance to trade near $37 also remains on the chart. If demand for the altcoin remains high, then SOL can try to trade above the $34 price mark.
The next trading sessions will determine if the altcoin remains bullish or not. The global cryptocurrency market cap today is $1.04 trillion, with a 6.9% positive change in the last 24 hours.
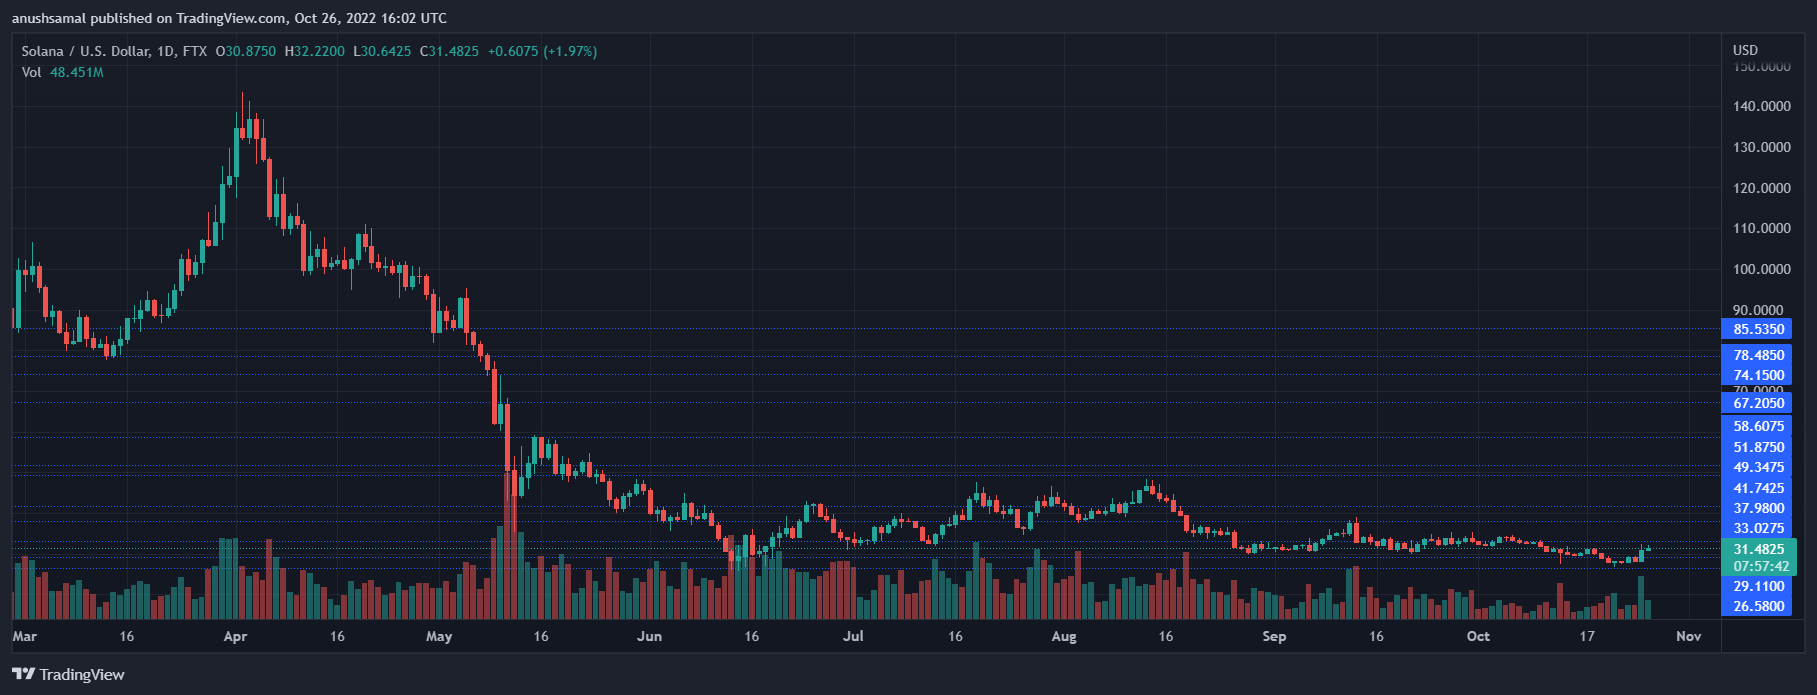
SOL was trading at $31 at the time of writing. The coin broke past its $30 price mark, which had long acted as a resistance for the coin.
At the moment, Solana price might find it hard to move past the $33 price mark, but moving past that level will pave the way for SOL to reach $37.
On the flipside, if the bulls lose momentum, Solana price will slip to $29. The other major support zone for the coin stood at $26.
The amount of Solana traded in the last trading session shot up, which was a sign of high demand and buying strength.
Buyers have slowly crept back into the market. However, there has not been a massive recovery on that front either.
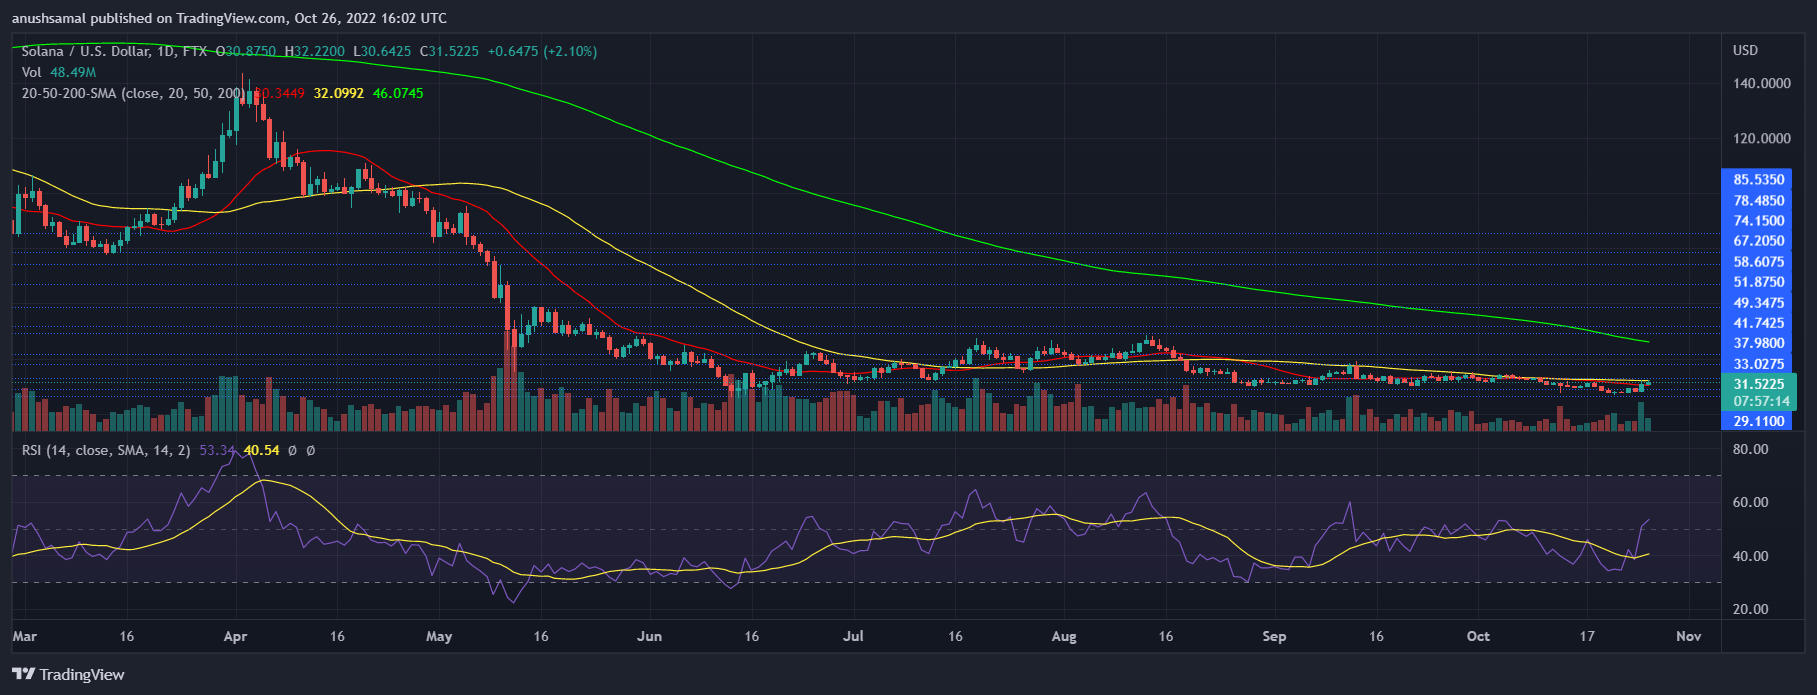
Technical indicators are positive, but it is important that SOL moves above its immediate price ceiling.
The Relative Strength Index had peeped above the half-line as buyers took over the chart.
Solana price also traveled above the 20-SMA line, which meant that buyers were driving the price momentum in the market as demand grew for the altcoin.
The other indicators have also sided with the bulls on the one-day chart, indicating that buying strength was greater than selling strength.
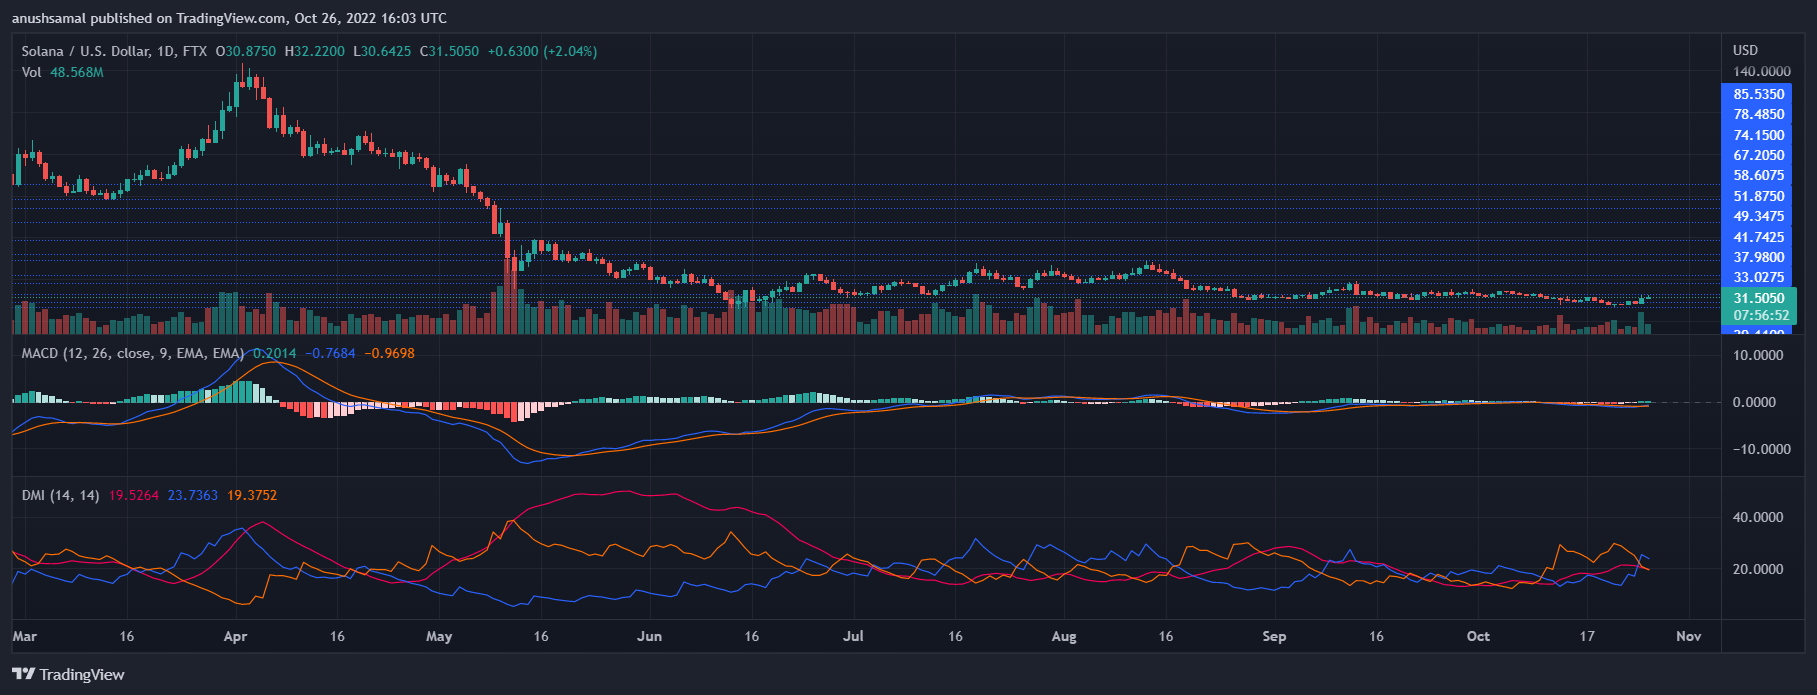
The Moving Average Convergence Divergence indicates the price direction and how strong the momentum is.
MACD pictured green histograms as they represented the buy signal for Solana. The Directional Movement Index also displays the price direction.
DMI was positive as +DI was above the -DI line. The Average Directional Index (red) was below 20, which is a sign of the price direction getting weaker.
Previous article


Copyright © 2021-2024 AssessCrypto All rights reserved.